Successful application of two-dimensional transition metal dichalcogenides in optoelectronic, catalytic, or sensing devices heavily relies on the materials’ quality, that is, the thickness uniformity, presence of grain boundaries, and the types and concentrations of point defects. Raman spectroscopy is a powerful and nondestructive tool to probe these factors but the interpretation of the spectra, especially the separation of different contributions, is not straightforward. Comparison to simulated spectra is beneficial, but for defective systems first-principles simulations are often computationally too expensive due to the large sizes of the systems involved. Here, we present a combined first-principles and empirical potential method for simulating Raman spectra of defective materials and apply it to monolayer MoS2 with random distributions of Mo and S vacancies. We study to what extent the types of vacancies can be distinguished and provide insight into the origin of different evolutions of Raman spectra upon increasing defect concentration. We apply to our simulated spectra the phonon confinement model used in previous experiments to assess defect concentrations, and show that the simplest form of the model is insufficient to fully capture peak shapes, but a good match is obtained when the type of phonon confinement and the full phonon dispersion relation are accounted for.


Structural defects can be either intentionally or unintentionally introduced into materials during their synthesis or processing, or they can naturally appear at finite temperatures due to the entropic contribution to the free energy of the system 1 . The defects can have either beneficial or detrimental effects on materials properties. For example, doping by foreign impurities can be used to increase carrier concentration, but at the same time the mobility decreases due to enhanced scattering 2 . They can also enable new technologies, e.g., point defects can be used as single-photon emitters or qubit hosts 3,4 in the field of quantum information. With the discovery of new materials, defects continue to be an active and important research area for both engineers and scientists. This seems to be especially relevant now with two-dimensional (2D) materials, such as graphene and transition metal dichalcognides (TMDs). Due to their high surface-to-volume ratio, essentially all the atoms are in contact with the environment. Because of this, not only the concentration of defects can be much larger than that in bulk systems because of interactions with reactive species, but it is also much easier to study and control defects in 2D systems than those buried in bulk materials (for an overview, see refs. 5,6,7,8,9,10,11 ).
Raman spectroscopy can be used as a qualitative and inexpensive diagnostic tool to characterize 2D materials, that is, to get information on the lateral size and the number of layers of flakes 12,13 , doping 14 , strain 15 , temperature 16,17 , and defect concentration 18 . The changes in Raman spectra of MoS2, the prototype material among TMDs, upon introduction of point defects have already been investigated 18,19,20,21,22 , and three different signatures of defects have been reported. First, there is a shift of the mode frequencies. In the case of MoS2, the frequency of the E \(^<\prime>\) peak shifts down while the A \(<>_^<\prime>\) peak remains roughly constant. Second, there is an asymmetric broadening toward lower frequencies below the E \(^<\prime>\) peak and toward higher frequencies above the A \(<>_^<\prime>\) peak. However, the previous studies remain inconclusive on whether this is pure broadening or whether it also involves new peaks. The asymmetric broadening can, at least qualitatively, be explained using the phonon confinement model (PCM) 18,23 , where it is assumed that defects lead to confinement of the Raman-active modes of a pristine system. Third, new peaks may arise from vibrational modes localized around the defects, possibly contributed by splitting of the degenerate modes due to symmetry lowering around the defect.
A common difficulty present in all experimental studies is that the exact density and types of the defects are not known, and it is, therefore, difficult to obtain a quantitative correspondence between the defect type or its concentration and the changes in the Raman features. In addition, the results may be affected by instrumental contributions, interaction with the substrate, synthesis, and transfer procedures, etc. To this end, few computational studies have also been carried out 20,21,24 . Unfortunately, there is also a problem in all these works, since only small supercell sizes are computationally tractable, which consequently leads to spurious effects arising from high concentrations of defects considered and their periodic arrangement. Simulating spectra in cases of randomly distributed defects at realistic concentrations requires very large supercells. Therefore, in order to advance the understanding of the changes observed in the measured Raman spectra, it is required to have computational tools with good predictive power and high computational efficiency.
We recently introduced a method for simulating Raman spectra of defective materials with very small computational cost. The method can be used once the vibrational eigenvectors of the non-pristine system and the Raman tensors of the pristine system are known 25 . The latter are easily obtained using first-principles calculations. However, since the first-principles evaluation of the vibrational eigenvectors is still computationally fairly demanding, in our previous work we only considered simple substitutional alloys, where the eigenvectors could be evaluated within the mass approximation 25 . Here, we explore the use of empirical potentials (EP) for determining the eigenvectors in the case of monolayer MoS2 with randomly distributed Mo and S vacancies. Our main aim is to benchmark the computational approach and, in particular, the quality of the EP in describing the eigenmodes. Although a quantitative comparison to the experimental data is difficult and not the focus here, all the experimentally observed trends are correctly reproduced. Moreover, we apply PCM to analyze the simulated Raman spectra. Armed with the knowledge on the exact defect concentrations and the full dispersion relation of the pristine host, we can assess the quality and applicability of PCM in a robust way.
The method for evaluating first-order non-resonant Raman spectra of defective materials as modeled using large supercells was recently introduced by us in ref. 25 . In brief, when calculating the Raman intensity of the supercell (SC) mode j, its Raman tensor R SC,j is obtained as a sum of the primitive unit cell (PUC) Raman tensors R PUC,i and the projections of the SC eigenmodes to the PUC eigenmodes at the Γ-point:
$$^>> \sim | >>_<<\mathrmwhere ei and es are the polarization vectors of the incident and scattered light, respectively, and wij is the projection weight. The vibrational eigenmodes are obtained in the conventional way by first determining the force constants and then solving the equations of motion for the ions. In ref. 25 , this method was denoted as RGDOS as it involves Raman tensor weighting of the Γ-point projected density of states (DOS).
This approach allows one to avoid the Raman tensor calculation for each supercell mode, but still requires evaluating vibrational eigenvectors, which can still be prohibitively expensive with large supercells if carried out by density-functional theory (DFT) calculations. For instance, directly constructing the force constant matrix in the case of a defective 10 × 10 MoS2 supercell requires about 900 DFT calculations (each of the 300 atoms should be displaced in three directions). Our present solution to this issue is to use empirical potentials to evaluate the force constants and consequently the vibrational eigenmodes. The Raman tensors of the pristine system are evaluated via DFT.
In the following, force evaluations are done with the reactive empirical bond order (REBO) potential combined with the Lennard–Jones (LJ) interaction 26,27 . REBO was mainly chosen because of its transferability and since it has been shown to describe well formation energies of point defects 28 and thermal conductivity 29 in MoS2. We note that some empirical potentials might provide more accurate descriptions of phonon dispersion curves of the pristine material, since they have been specifically fitted to dispersion curves, but their application to defective systems would require a careful verification.
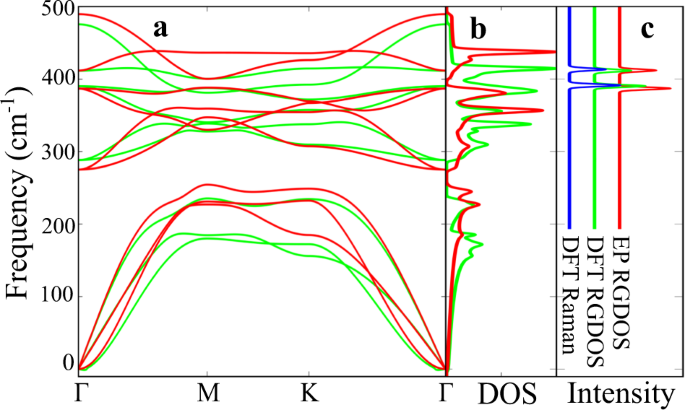
To investigate the reliability of the REBO potential, we compare phonon dispersion curves calculated by DFT and EP for monolayer MoS2 in Fig. 1a. Since we are mainly interested in the two Raman-active modes at the Γ-point (E \(^<\prime>\) at about 390 cm −1 and A \(<>_^<\prime>\) at about 410 cm −1 ), we have scaled the EP frequencies by 0.975 to align them with the DFT values. This also brings the calculated frequencies in close agreement with the experimental values. The dispersion of the bands around the Γ-point is reproduced fairly well for the E \(^<\prime>\) -mode, but the A1 mode bends strongly upwards in the EP resuls while it is noticeably flatter in the DFT case.
To investigate vibrational properties as a function of the defect concentration, we created large supercells with randomly distributed point defects. Here we focus on the vacancy-type defects: a missing Mo atom (Movac), a missing S atom (Svac), and two missing S atoms on top of each other (S2vac). Svac is the most common defect in MoS2 30,31,32,33 , but depending on the preparation or synthesis method Movac may also be present 32,33 . We used 10 × 20 hexagonal supercells with different numbers of vacancies to cover defect concentrations from 0.5 to 5%. At each concentration, we generated five random configurations, over which the presented spectra are averaged over. We also compared the results to those obtained by ordered arrays of defects, where one defect is created in a supercell with its size ranging from 4 × 5 to 10 × 10 PUCs in the case of S2vac and Movac (defect concentration 0.23–5.0%), and from 3 × 4 to 15 × 15 PUCs in the case of Svac randomly placed on the two sides of the layer (defect concentration 0.22–4.2%). Note that the defect concentration is defined as the number of defects per available defect sites, but there are two sites per unit cell for Svac and only one site for S2vac and Movac. While the use of large supercells leads to thousands of displacements, depending on the symmetry of the optimized supercell, evaluation of the forces for each displaced structure takes generally only few seconds on a single CPU core.
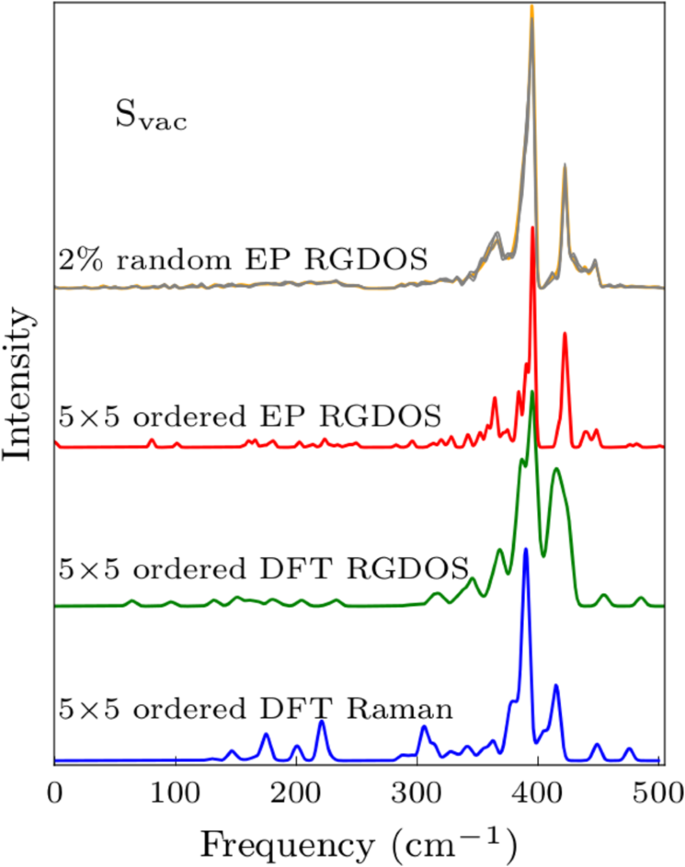
Now we have all the ingredients needed for calculating RGDOSs. Starting with a trivial case, Fig. 1b shows the comparison between the full DFT calculated Raman spectrum, DFT RGDOS, and EP RGDOS in the case of pristine MoS2. RGDOSs correctly pick up the active modes from the total DOS with correct intensities. As a more challenging test case, Fig. 2 compares the results for 2% Svac systems in random and ordered arrangements. The ordered system corresponds to a single Svac in a 5 × 5 PUCs supercell. Comparison between the DFT Raman and DFT RGDOS shows that RGDOS again correctly picks up the Raman-active modes from all the states that are folded to the Γ-point, although there are some differences in the intensities. DFT and EP RGDOSs are also in a fairly good agreement, suggesting that the modification of the vibrational modes by defects are correctly captured by EP. In Fig. 2, we also show the EP RGDOS for the same Svac concentration (2%), but randomly distributed in a large SC and averaged over 5 different configurations. While the ordered configuration already exhibits all the main features, it is difficult to ascertain which of the peaks arise from the broadening of the main features and which would evolve as extra peaks.
The simulated Raman spectra for randomly distributed vacancies with different concentrations are shown in Fig. 3a–c and the peak position shifts of the E \(^<\prime>\) and A \(<>_^<\prime>\) modes are illustrated in Fig. 3d–f. We find that: (i) For all defects, the E \(^<\prime>\) mode shifts to lower frequencies with a similar rate of about 2–3 cm −1 for the 5% defect concentration. We remind that with our definition of the defect concentration the number of missing S atoms in the S2vac case is twice that for Svac. This means that the shifts are governed mostly by the number of defects and not by their size. (ii) In the case of Svac and S2vac, the A \(<>_^<\prime>\) mode remains nearly intact, whereas in the case of Movac also the A \(<>_^<\prime>\) peak experiences a pronounced downshift with increasing defect concentration. (iii) The peak shifts in the cases of random and ordered defects are always in a close agreement with the exception of the small deviations in the case of the S2vac E \(^<\prime>\) mode. (iv) In addition to the peak shifts, the simulated spectra in Fig. 3a–c show also a clearly increasing asymmetric broadening of the peaks as well as an emergence of additional broad peaks at around 355 cm −1 and 435 cm −1 . (v) Movac shows an additional peak at about 5 cm −1 above the E \(^<\prime>\) peak with the frequency independent of defect concentration.
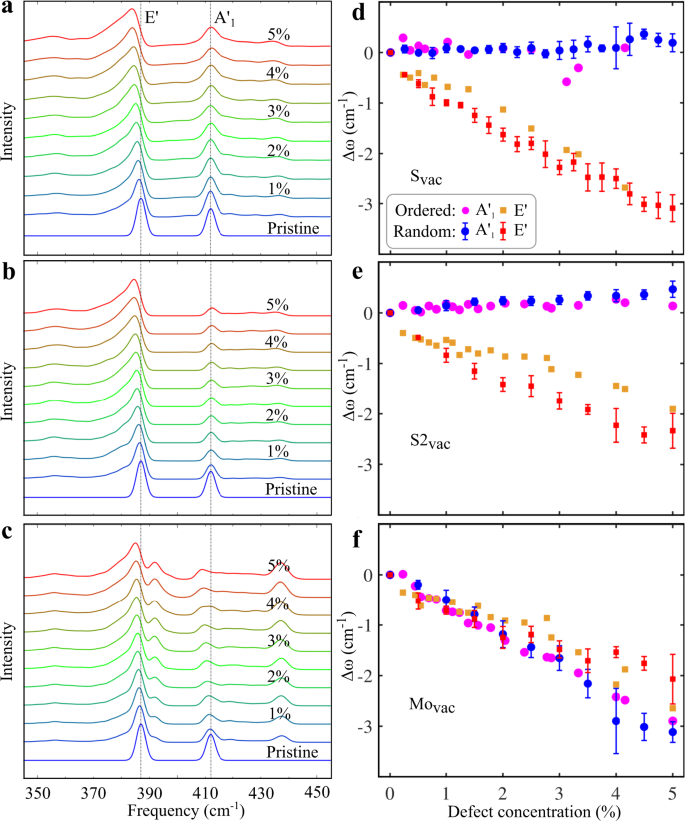
Our results for Svac are in a good agreement with the results of previous experimental and computational studies 18,19,20,21,22 , which also show the E \(^<\prime>\) mode shifting downward and the A \(<>_^<\prime>\) mode remaining at a fixed frequency. Comparing the magnitude of the shift is more challenging. Parkin et al. report about an 8 cm −1 peak shift for the 4% vacancies concentration 20 , which is more than twice that in our calculations. In contrast, a 3–4 cm − 1 shift for a similar vacancy concentration was reported by Mignuzzi et al. 18 , which is close to our results. The different experimental details make it difficult to directly compare the results. In ref. 20 the defects were created by electron irradiation and their concentration evaluated using a sputtering cross section from selected-area electron diffraction, while in ref. 18 the defects were created using Mn + ion irradiation and their concentration evaluated directly from the ion dose. Here we do not want to argue which experimental report is the most reliable, but the similarity of the Svac and S2vac results shows that part of the discrepancy could arise from different degrees of vacancy clustering. Naturally, our computational approach relying on EP may also lead to inaccuracies in the peak shifts. Our shifts are smaller than the DFT calculated ones in ref. 20 , which could arise from the different exchange-correlation functionals. We note that the peak shift obtained from our full DFT calculation for the case of 2% S vacancy concentration (cf. Fig. 2) is 1.3 cm −1 , which is close to the shift obtained from EP RGDOS.
The asymmetric broadening of the peaks, the E \(^<\prime>\) mode shifting to lower frequencies, and the independence of these features on the defect size (Svac vs. S2vac) are all consistent with the PCM. According to PCM, phonons are confined to pristine regions of the sample, away from defects, and the sizes of these regions decrease as the defect concentration increases. This can be verified by visualizing the eigenmodes that contribute most to the selected peaks of the simulated Raman spectra, as shown in Fig. 4 in the case of a single vacancy defect placed in a supercell of 20 × 20 PUCs. For the all defect types, the E \(^<\prime>\) mode is localized away from the defect. The size of the “excluded” region slightly depends on the defect, and the larger size in the case of S2vac could be due to the larger extent of the localized strain field. We note that the non-spherical appearance arises from the fact that we are visualizing only one of the two perpendicular E \(^<\prime>\) modes. The PCM also predicts how the Raman peak shape evolves with increasing confinement: a confining potential in the real space leads to broadening in the k-space and thereby activation of states around the Γ-point. As a result, the peak broadening should reflect the band dispersion around the Γ-point, and consequently also the peak maximum will shift slightly following the band dispersion. That is, the negative curvature of the E \(^<\prime>\) mode, for instance, should lead to a shift to lower frequencies, which is consistent with the simulated spectra.
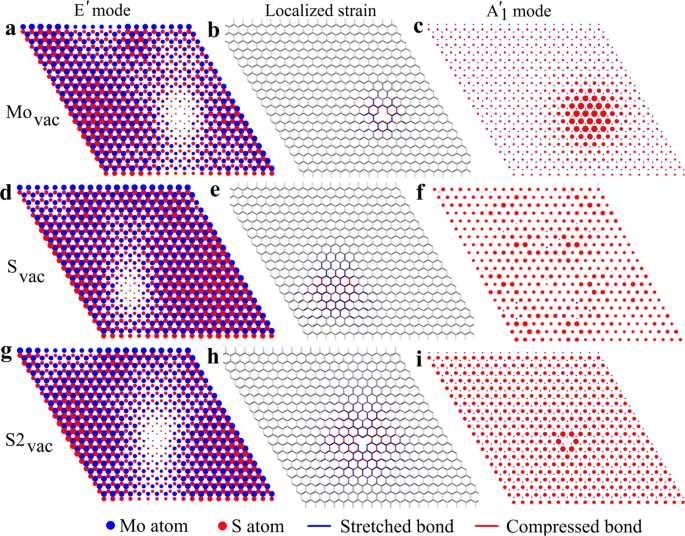
The changes in the A \(<>_^<\prime>\) peak position and broadening are not consistent with PCM. As shown in Fig. 4c, f, i, the modes which mostly contribute to the A \(<>_^<\prime>\) peak remain largely unaffected by the Svac and S2vac defects, and are resonant with the defect in the case of Movac. On the other hand, according to PCM, the A \(<>_^<\prime>\) peak should exhibit asymmetric broadening and a shift to higher frequencies, since the corresponding band has a positive curvature (cf. Fig. 1). Presumably, due to the minor effect of Svac on this mode, the peak shift and broadening are very minor, as seen in Fig. 3. At large defect concentrations, there is an extra structure above the A \(<>_^<\prime>\) peak that clearly follows the dispersion of the corresponding phonon band, starting from 412 cm −1 at the Γ-point to about 440 cm −1 at the Brillouin zone edges (cf. Fig. 1). One can expect that with a better force-constant model this feature would move much less, and, indeed, it is mostly absent in the DFT calculated Raman spectra and DFT RGDOS shown in Fig. 2. This feature likely arises from the highly localized nature of the (small) modifications of the eigenmodes around the defect, which then leads to activation of the modes with relatively large wave vectors. As for Movac, we assign the downshift of the A \(<>_^<\prime>\) mode to the localization of the mode around the defect, where the bonds may be weakened and also local strain contributions may play a role. In addition, the new mode at 393 cm −1 is a purely localized mode around the Mo vacancy. In this mode, the vibrations are in-plane and found to originate from the E \(^<\prime>\) mode.
Thus far, we have invoked PCM only in a qualitative manner. We now investigate the peak shape in more detail and compare RGDOSs to the peak shapes obtained using PCM. We consider phonons confined within an envelope function described by a Gaussian \(c(r)=\exp (-^/2^)\) . The variance σ describes the confinement, but preferably needs to be connected to the geometric parameters describing the system. When the confinement is within a (spherical) grain of diameter L, one might, for instance, equate L with the full width at the half maximum of the Gaussian (L ≈ 2.355σ). However, this is not the only possible choice and it is not a priori clear how to choose it. Consequently, it can be impossible to extract precise quantitative data about the grain sizes using PCM.
Now, we consider a wave function originally at q0, \(\psi (>>_,>)=\exp (-i>>_\cdot >)u(>>_,>)\) , following the notation in the original PCM paper 16 . Due to the confinement by c(r) in the real space, the wave function spreads in the reciprocal space as ψ(q0, q) = C(q0, q)u(q0, q) where C(q0, q) is the Fourier transform of c(r),
$$C(>>_,>)=\exp \left(-\frac<<\left(>->>_\right)>^^>\right)\frac<2\pi >.$$In order to obtain the line shape, we assume that the phonon transition matrix element can be simplified as \(| M<| >^=C<(<>>_,>)>^\) 23 , which we then integrate over the Brillouin zone and obtain $$I(\omega )=><\int>_>>| M<| >^\gamma (\omega -<\omega >_(>))d>,$$where we have also summed over bands i. ωi(q) is a mode frequency and γ is a broadening function, which is here the same as used for broadening the RGDOSs.We note that in the literature Eq. (4) is often evaluated using the parabolic approximation for the dispersion relation around the Γ-point. This might be appropriate for very weakly confined phonons, but we found it insufficient in our case due to the large extent of C(q0, q) in the reciprocal space, which makes it sensitive to (i) non-parabolicity of the bands, (ii) anisotropy of the bands, and (iii) breaking of the E-mode degeneracy, as already recognized in the literature 34,35 . Thus we explicitly integrated over the BZ using the calculated dispersion relation, which enters Eq. (4) via ωi(q). The extent of the reciprocal space broadenings are illustrated in Fig. 5d for three different values of L. Here we have chosen, somewhat arbitrarily, L = 2σ. Fig. 5a shows the spectra when PCM is applied to the E \(^<\prime>\) mode with L fitted to yield the best match. The quality of the fits is reasonable at high defect concentrations, but becomes poorer at low concentrations. The fitted values of L shown in Fig. 5c do not appear to follow the expected \(1/\sqrt_>>\) behavior. Both observations suggest that the employed model can not capture the calculated spectral features in a satisfactory way.
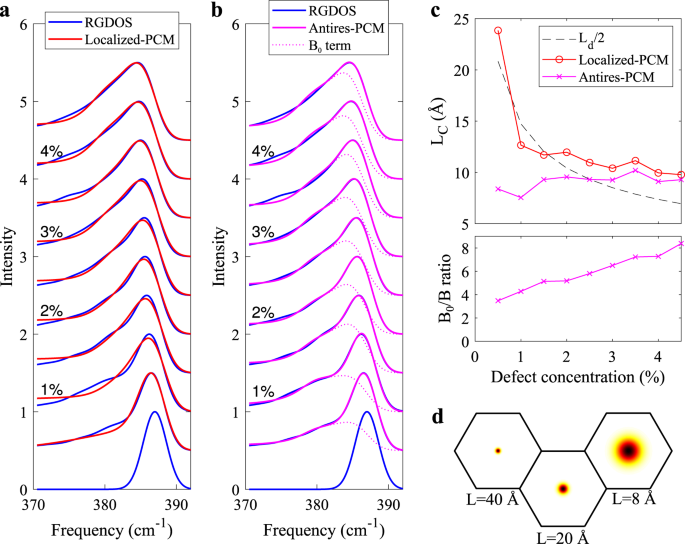
We found, however, that the poor agreement between PCM fits and RGDOSs is not due to the deficiency of PCM itself, but rather due to improper modeling of the the confinement envelope, as alluded above. In fact, the E \(^<\prime>\) mode is best described as being an antiresonance around the defect, cf. Fig. 4g. To model antiresonant modes, we write our Fourier coefficients as
$$C(>>_,>)=_\delta (>=>>_)-B\exp \left(-\frac<<\left(>->>_\right)>^^>\right)\frac<2\pi >.$$In practice, the delta function is replaced by another, very narrow Gaussian that is normalized to B0. We fit using this model, which essentially entails two fitting parameters: B/B0 and L. Due to the normalization of the spectra, only the ratio B/B0 is significant. Figure 5b shows the fitted spectra. The agreement at low defect concentrations is very good, although it somewhat deteriorates at high concentrations. Figure 5c, d shows that the width of the antiresonant Gaussian remains nearly constant, whereas the B/B0 ratio increases linearly with defect concentration. Both of these observations are in line with the expected behavior from the antiresonant model. The deterioration of fits at high defect concentrations could be related to the overlap of the Gaussians. Since the Gaussians are no longer isolated, this effectively leads to a distribution of antiresonance “holes” of different sizes, which additionally smoothens the Raman peak. There may be also other indirect contributions from defect-defect interactions.Thus, we have demonstrated that PCM is able to describe well the peak broadening in defective materials if the modeling is done carefully. This conclusion is independent on how well our EP-RGDOS manages to reproduce the spectra of explicit DFT calculations or those of experiments. Therefore, to guide future work, we propose the following approach to accurately fit the experimental spectra: (i) Calculate phonon dispersion using an accurate first-principles method to guarantee the correct dispersion of the bands. (ii) Carry out calculation for the defect to find out how the pristine modes are confined (localized, resonant, or antiresonant). (iii) With the known confinement model, apply PCM as demonstrated above via integration of the dispersion relation over the BZ.
We have demonstrated a method for simulating Raman spectra of defective materials based on a combination of empirical potentials and first-principles calculations. The empirical potentials are used to evaluate the vibrational modes of the defective system, which are then combined with Raman tensors evaluated from the first-principles calculations. This approach allows us to not only reliably simulate Raman spectra, but also gain insights into the physics of vibrational modes in defective systems and how they can be probed with Raman spectroscopy. We used this method to study vacancies in monolayer MoS2. We captured the effect of defects on the shifts and on the asymmetric broadening of the prominent peaks, with the results being in a qualitative agreement with experimental data. We then used the phonon confinement model to fit our simulated Raman spectra to assess the applicability of the model in the context of defective materials. We found it to work well when the full dispersion relation and the type of confinement are accounted for. The approach presented here allows for efficient evaluation of the Raman spectra of defective systems provided that an appropriate empirical potential is available.
Empirical potential calculations are done by the LAMMPS code (http://lammps.sandia.gov) with the reactive empirical bond order (REBO) potential combined with the Lennard–Jones (LJ) interaction 26,27 . The structures are optimized within the NVT ensemble at T = 0.
Our DFT calculations are carried out using the VASP program package 36 . We use the Perdew–Burke–Ernzerhof revised for solids (PBEsol) 37 exchange-correlation functional. A plane wave basis with a 550 eV cutoff energy is employed to represent the electronic wave functions. During the structural relaxation for MoS2 PUC, a 15 × 15 × 1 k-mesh is used. The total energies in both geometry relaxation and in phonon calculations were converged to within 10 −6 eV and the forces within 10 −3 eV/Å, to guarantee accurate evaluation of forces for the initial and displaced structures. The polarizability tensors for Raman spectra 38 were determined with the same parameters as above through calculations of the changes of the dielectric constant upon finite displacements of atoms. The simulated spectra are evaluated in the (XX + YY)/2 polarization configuration.
With both DFT and EP, phonon spectra were assessed by using the PHONOPY code 39 within the method of finite displacements. Our results match well with the previous DFT calculations and also with experiments 40,41 .
All data used to generate the results in this paper can be obtained from the corresponding author upon reasonable request.